
An attractive equity curve, consistent new highs and impressive performance statistics can be deceiving. Sometimes, the most important indicator of a strategy’s viability is the one that receives the least attention.
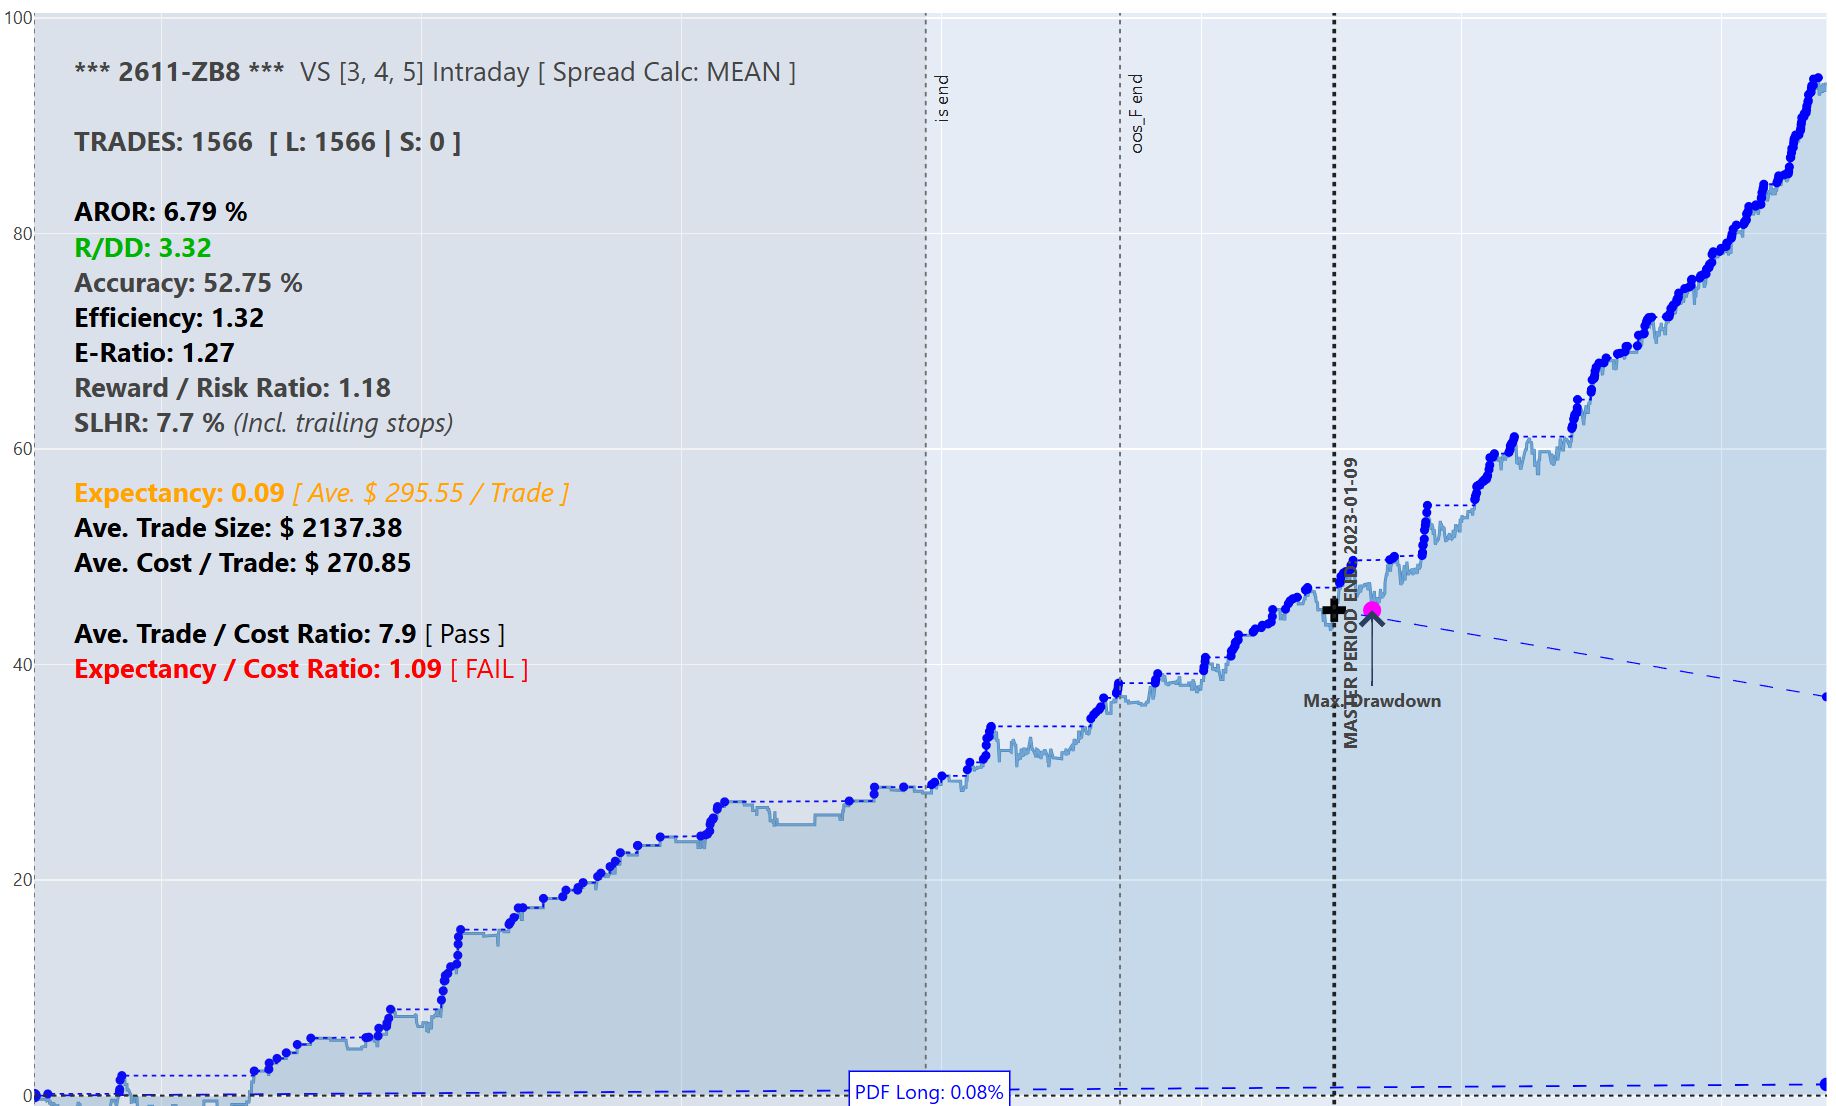
Chart: CADCHF trading strategy backtest result (Generated with QF Alphawolf software)
At first glance, this looks like a strategy most traders would be happy to trade. The equity curve is smooth, drawdowns appear controlled, and the system consistently makes new equity highs. With 13 years of historical data, more than 1,500 trades and a respectable collection of performance metrics, there seems to be little reason for concern.
But would you actually trade it?
Despite its attractive appearance, this particular strategy has a significant weakness: its Expectancy / Cost Ratio is just 1.09.
This is a particularly important distinction in quantitative trading. A strategy can be historically profitable, statistically consistent and visually impressive, yet still be economically unsuitable for live trading.
In fact, strategies like this can be surprisingly deceptive. Their backtests often look sufficiently convincing to pass conventional performance evaluations, while their underlying trading economics leave very little room for execution costs, slippage or changing market conditions.
Let’s explore why this happens, why it is so easily overlooked, and what can be done to improve it.
1. The Illusion of a Good Equity Curve
One of the most common mistakes in systematic trading is placing too much emphasis on the appearance of an equity curve and conventional performance statistics.
A smooth, consistently rising equity curve naturally creates confidence. It suggests that a strategy has identified a persistent market inefficiency and is extracting it reliably.
However, an equity curve only tells part of the story.
Consider the following backtest statistics:
| Performance Metric | Result |
|---|---|
| Backtest period | 13 years |
| Number of trades | 1,570 |
| Return / Drawdown | 2.90 |
| Win rate | 53% |
| Profit Factor | 1.32 |
| E-Ratio | 1.27 |
| Reward / Risk | 1.18 |
| Average winning trade | $4,220 |
| Average losing trade | $3,560 |
| Average transaction cost | $495 |
| Average gross expectancy | $540 |
| Expectancy / Cost Ratio | 1.09 |
On the surface, these results look reasonably attractive. The strategy has generated positive returns over a substantial historical period, with a relatively stable equity curve and a respectable return-to-drawdown relationship.
But look more closely at the actual trading economics.
The strategy generates approximately $540 in gross expectancy per trade, while the average transaction cost is $495.
This means that approximately 92% of the strategy’s gross statistical edge is consumed by transaction costs.
After costs, only $45 remains.
In other words, the strategy is generating a positive return, but its underlying edge is extremely thin relative to the cost of extracting it.
This is where the Expectancy / Cost Ratio becomes particularly important.
2. Understanding the Expectancy / Cost Ratio
Expectancy measures the average amount a trading strategy is expected to make or lose per trade over a sufficiently large sample.
It takes into account both winning and losing trades, including their respective probabilities and average magnitudes.
The Expectancy / Cost Ratio measures this statistical edge relative to the cost of executing the trades.
Expectancy / Cost Ratio = Gross Expectancy ÷ Average Transaction Cost
For example, consider three strategies with identical transaction costs of $500 per trade:
| Strategy | Gross Expectancy | Cost | Ratio |
|---|---|---|---|
| Strategy A | $550 | $500 | 1.10 |
| Strategy B | $750 | $500 | 1.50 |
| Strategy C | $1,000 | $500 | 2.00 |
All three strategies are profitable before transaction costs, but their economic viability differs considerably.
Strategy A has very little margin for error. Even relatively small increases in spreads, commissions or slippage can eliminate its profitability.
Strategy C, on the other hand, has considerably more room to absorb execution costs and changing market conditions.
This is the fundamental principle: the larger the statistical edge relative to transaction costs, the more resilient a strategy is likely to be in live trading.
A higher ratio does not guarantee profitability, of course. It is one component of a broader assessment of strategy robustness, but an important one.
3. Why Good-Looking Strategies Can Have Poor Cost Efficiency
There are several reasons why a strategy can produce attractive historical performance while having a surprisingly low Expectancy / Cost Ratio.
Small Statistical Edges
Some strategies are designed to capture relatively small market movements. They may have a reasonable win rate, consistent trade frequency and relatively stable returns.
However, the underlying price movements being captured may not be particularly large relative to the transaction costs required to enter and exit positions.
This is especially relevant to short-term strategies, mean-reversion systems and strategies that generate frequent trades.
A strategy might consistently identify profitable trading opportunities, but if the average gross profit per trade is only marginally larger than the cost of execution, its economic viability becomes questionable.
The Profit Factor Can Be Misleading
Profit Factor is a useful performance metric, but it does not directly measure the efficiency of a strategy relative to transaction costs.
A Profit Factor of 1.30 means that the strategy generates $1.30 in gross profits for every $1.00 in gross losses.
However, this says nothing about how much of that profit is consumed by spreads, commissions and slippage.
A strategy can therefore have a respectable Profit Factor while retaining very little net profitability after transaction costs.
Smooth Equity Curves Can Hide Weak Trading Economics
A consistently rising equity curve is not necessarily evidence of a strong underlying trading edge.
A strategy can generate a large number of relatively small profitable outcomes, with losses distributed sufficiently evenly to produce a smooth historical equity curve.
Over a long enough historical period, this can create an impressive-looking result.
But if the average statistical edge is only marginally larger than the transaction costs, the strategy may be much more sensitive to real-world execution conditions than its equity curve suggests.
Historical Transaction Costs Are Not Always Representative
Backtesting relies on historical assumptions about spreads, commissions and execution.
Even when these assumptions are reasonably accurate, actual live trading can introduce additional costs through:
- Spread fluctuations and periods of reduced liquidity.
- Slippage during volatile market conditions.
- Execution delays and price gaps.
- Differences between theoretical and executable prices.
- Broker-specific execution conditions.
For strategies with a strong underlying edge, these differences may be relatively insignificant.
For strategies with very low expectancy relative to costs, even small discrepancies can have a substantial impact on profitability.
4. Why This Can Fool Even Experienced Traders
The problem is that conventional backtest metrics tend to reward historical profitability without necessarily measuring how efficiently that profitability is generated.
A trader sees:
- A smooth equity curve.
- Consistent new equity highs.
- A respectable Profit Factor.
- A reasonable win rate.
- Controlled historical drawdowns.
- Positive returns over many years.
Naturally, the conclusion is that the strategy is viable.
But these metrics can collectively create a false sense of confidence if the underlying expectancy is not sufficiently large relative to transaction costs.
There is also a statistical consideration.
A strategy with a small but relatively persistent edge can produce a convincing historical equity curve, particularly over thousands of trades. However, the existence of a positive historical edge does not necessarily mean that the edge is large enough to survive the uncertainties of live execution.
This is an important distinction between historical profitability and practical tradability.
The objective should not simply be to identify strategies that made money in the past. It should be to identify strategies with sufficiently strong and robust trading economics to remain profitable under realistic execution conditions.
5. Improving the Expectancy / Cost Ratio
Fortunately, a low ratio does not necessarily mean that a strategy should be discarded.
There are two fundamental ways to improve it:
- Increase gross expectancy.
- Reduce average transaction costs.
Ideally, both should be addressed.
Improve Entry Selectivity
One of the most promising approaches is to improve the quality of trades rather than simply increasing trading frequency.
Consider whether certain market conditions produce significantly better trading outcomes.
Potential areas of investigation include:
- Trend strength and directional momentum.
- Volatility regimes.
- Market structure and price location.
- Time-of-day effects.
- Signal confidence and model predictions.
- Market regime classification.
The objective is to identify conditions under which the strategy produces a stronger statistical edge.
However, additional filters should be evaluated carefully. Removing trades can improve the ratio without necessarily improving the overall profitability of the strategy.
The important consideration is whether the resulting strategy produces better net performance, not simply a higher ratio.
Investigate Instruments Individually
A multi-instrument strategy may contain considerable differences in trading efficiency between instruments.
Some markets may offer relatively attractive opportunities with low transaction costs, while others may generate similar gross expectancy but substantially higher execution costs.
Calculating the Expectancy / Cost Ratio independently for each instrument can reveal these differences.
Persistently inefficient instruments may be candidates for exclusion, provided the improvement holds up in independent out-of-sample testing.
Optimise Trading Sessions
Transaction costs and market behaviour vary throughout the trading day.
Liquidity, spreads and volatility can differ significantly between trading sessions, market openings and closing periods.
A strategy may perform particularly well during certain hours while generating relatively poor risk-adjusted returns during others.
Analysing expectancy and transaction costs by trading hour can help identify periods where the strategy’s trading economics are less favourable.
Avoiding consistently inefficient trading periods can improve overall cost efficiency without necessarily changing the underlying strategy logic.
Improve Exit Efficiency
Another possibility is that the strategy identifies reasonably good entries but does not extract enough value from the resulting price movements.
Analysing Maximum Favourable Excursion (MFE) and Maximum Adverse Excursion (MAE) can help identify opportunities to improve trade management.
For example, investigate:
- How much of the available favourable excursion is captured?
- Are profitable trades being closed prematurely?
- Are losing trades being allowed to develop unnecessarily?
- Would alternative trailing stops or exit conditions improve realised expectancy?
The objective is to extract more value from existing trading opportunities without introducing excessive additional risk.
Reduce Transaction Costs
Finally, execution costs should be examined independently of the strategy itself.
Potential improvements include:
- Avoiding periods of unusually wide spreads.
- Reviewing broker and account execution conditions.
- Reducing unnecessary trading activity.
- Avoiding instruments with disproportionately high transaction costs.
- Improving order execution where possible.
Importantly, transaction costs should be measured using realistic historical execution assumptions rather than relying exclusively on average or theoretical spreads.
6. Stress-Test Your Trading Costs
A particularly useful exercise is to evaluate how sensitive a strategy is to increases in transaction costs.
Consider the example strategy again:
- Gross expectancy: $540
- Average transaction cost: $495
- Expectancy / Cost Ratio: 1.09
What happens if actual live trading costs are just 10% higher than anticipated?
The average cost increases to $544.50, effectively eliminating the strategy’s expected profitability.
At 25% higher costs, the strategy becomes significantly unprofitable.
This is a serious weakness.
A robust strategy should ideally retain positive expectancy under reasonably conservative execution assumptions.
I would therefore recommend testing strategies under multiple cost scenarios, rather than relying exclusively on the historical average transaction cost.
This provides a much clearer understanding of how much execution uncertainty a strategy can tolerate.
7. What Is a Good Expectancy / Cost Ratio?
There is no universal threshold that guarantees a strategy is suitable for live trading. The appropriate ratio depends on the trading frequency, instrument, execution environment and stability of the underlying edge.
Nevertheless, the following guidelines can be useful when evaluating strategies:
| Expectancy / Cost | Assessment |
|---|---|
| Below 1.00 | Insufficient gross edge to cover costs |
| 1.00 – 1.25 | Very thin margin; generally undesirable |
| 1.25 – 1.50 | Marginal; requires further investigation |
| 1.50 – 2.00 | More acceptable, but still execution-sensitive |
| 2.00 – 3.00 | Reasonably healthy cost efficiency |
| Above 3.00 | Stronger margin relative to costs |
These are indicative research guidelines, not universal statistical cut-offs.
A ratio above 1.50 would generally be a more attractive starting point than 1.09, although I would personally prefer to see ratios closer to 2.00 or higher wherever practical.
It is also important to remember that a high ratio alone does not make a strategy good. A strategy with a ratio of 3.00 but extremely unstable returns, excessive drawdowns or insufficient trade frequency may still be unsuitable.
The objective is to find a balance between statistical edge, trading frequency, drawdown characteristics and execution efficiency.
8. Look Beyond the Aggregate Strategy Metrics
Another important consideration is that aggregate performance statistics can conceal significant differences in trading behaviour.
A strategy might have an overall Expectancy / Cost Ratio of 1.50, but this could consist of:
- Certain instruments with ratios above 3.00.
- Other instruments with ratios below 1.00.
- Long trades performing considerably better than short trades.
- Particular trading sessions generating most of the profitability.
- Specific market regimes contributing disproportionately to the overall result.
Looking at the aggregate strategy alone would conceal these differences.
For a more comprehensive evaluation, expectancy and transaction costs should be analysed across multiple dimensions, including instruments, trading direction, time of day, volatility regimes and historical periods.
This helps identify where the strategy actually makes its money, where it loses its edge and which trading conditions contribute most to its overall profitability.
It also helps distinguish a genuinely robust strategy from one whose historical performance depends on a relatively narrow set of favourable conditions.
Conclusion: A Good Backtest Is Not Necessarily a Good Trading Strategy
The example presented in this article illustrates an important lesson in quantitative trading.
A strategy can have a beautiful equity curve, consistent historical returns and respectable performance statistics, yet still be unsuitable for live trading.
The reason is simple: profitability alone does not tell us how efficiently that profitability is generated.
Transaction costs are not a secondary consideration. They are an integral part of the trading strategy itself.
A strategy that generates a substantial statistical edge relative to its execution costs has considerably more room to accommodate slippage, changing market conditions and other real-world uncertainties.
A strategy with a very thin edge has considerably less.
Ultimately, the objective should not be to develop strategies that simply look good in a backtest. It should be to develop strategies with robust, repeatable and economically viable trading characteristics.
So, the next time you encounter a beautiful equity curve, ask yourself one question:
Would you actually trade this strategy?